

If you are buying land or a flat in Chennai, Chengalpattu, Kancheepuram or Tiruvallur, a clear EC and proper patta are not enough.
You must also understand the physical location of the property, its elevation, and how rainwater naturally flows in that area. This is important because even legally clear properties can face serious flooding issues, if they are built on low-lying land or natural drainage paths.
Verified.RealEstate analysed all 16,222 *polygons in Tamil Nadu’s ^flood-inundation layer.
The complete statewide and district table and the methodology are covered in Verifed.RealEstate’s separate Tamil Nadu flood-map analysis: https://community.verified.realestate/article/tamil-nadu-flood-map-8904-sq-km-across-all-38-districts-is-mapped-flood-prone/
The findings for the Chennai metropolitan belt are serious.
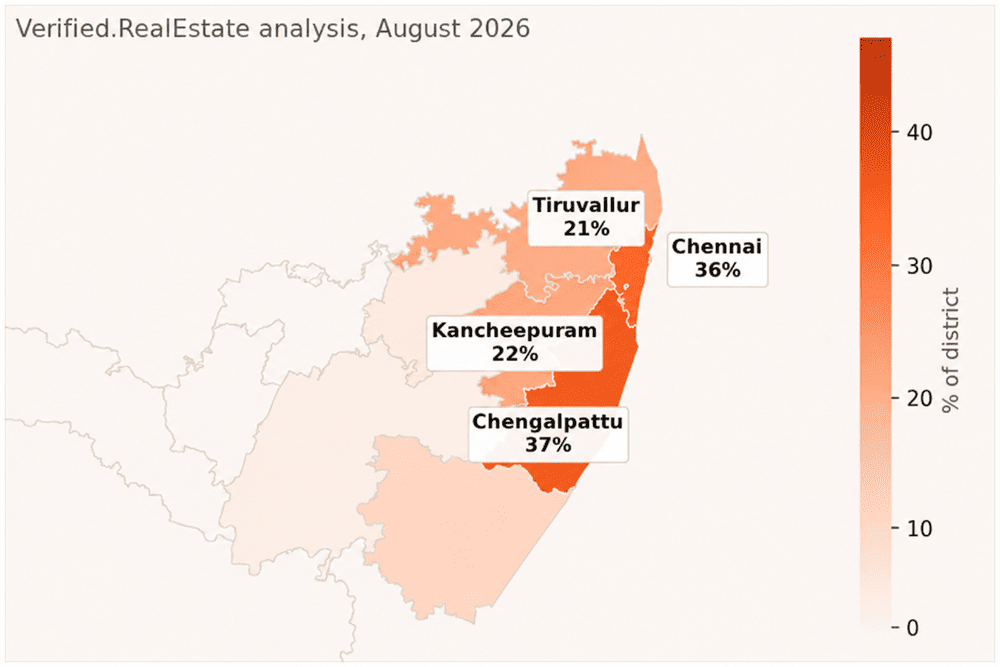
| District | Flood-prone share | Flood-prone area | Acres |
|---|---|---|---|
| Chengalpattu | 36.99% | 978 sq km | 241,613 |
| Chennai | 35.62% | 157 sq km | 38,867 |
| Kancheepuram | 21.93% | 374 sq km | 92,357 |
| Tiruvallur | 20.66% | 667 sq km | 164,790 |
Together, these four districts form the Chennai metropolitan flood belt. Around 27.14% of its combined land area—537,627 acres—is mapped as flood prone.
*A polygon is a closed shape used on a digital map to mark a specific area. Here, each polygon represents a separate patch of land identified as flood-inundation-prone.
^A flood-inundation layer is a map layer that shows areas likely to be submerged during flooding events.
Why El Niño Increases the Need for Caution
Tamil Nadu relies heavily on the October–December northeast monsoon for its seasonal rainfall. While El Niño often weakens the summer monsoon across India, it typically has the opposite effect in the south—frequently triggering heavier rainfall and extreme weather events.
Climate projections for late 2026 highlight a significant risk:
- NOAA Outlook: Reports an 81% probability of a very strong El Niño during October–December 2026, with a 97% chance of it persisting into early 2027.
- IRI Forecast (July 2026): Showed sea surface temperatures in the central Pacific (+2.1°C) reaching strong El Niño thresholds, with 23 out of 26 climate models predicting a peak during the late-year monsoon.
A strong El Niño does not guarantee that every street will flood. However, it significantly raises the chances of extreme rain, making it essential to evaluate a property’s elevation, natural terrain, and drainage capacity before the season begins.
Why Chengalpattu deserves special attention
Chengalpattu has 978 sq km or 241,613 acres of mapped flood-prone land. That is 36.99% of the district.
This district includes major parts of the OMR and GST Road growth corridors. It is also where a large share of Chennai’s new housing projects, plotted developments and land demand is concentrated.
The attractive location shown in a property advertisement may be only one part of the story. The exact survey field could be near a marsh, tank, canal, river, distributary channel or other low-lying area that collects water.
Buyers should therefore check the exact survey number—not merely the project name, neighbourhood or PIN code.
Chennai, locality by locality
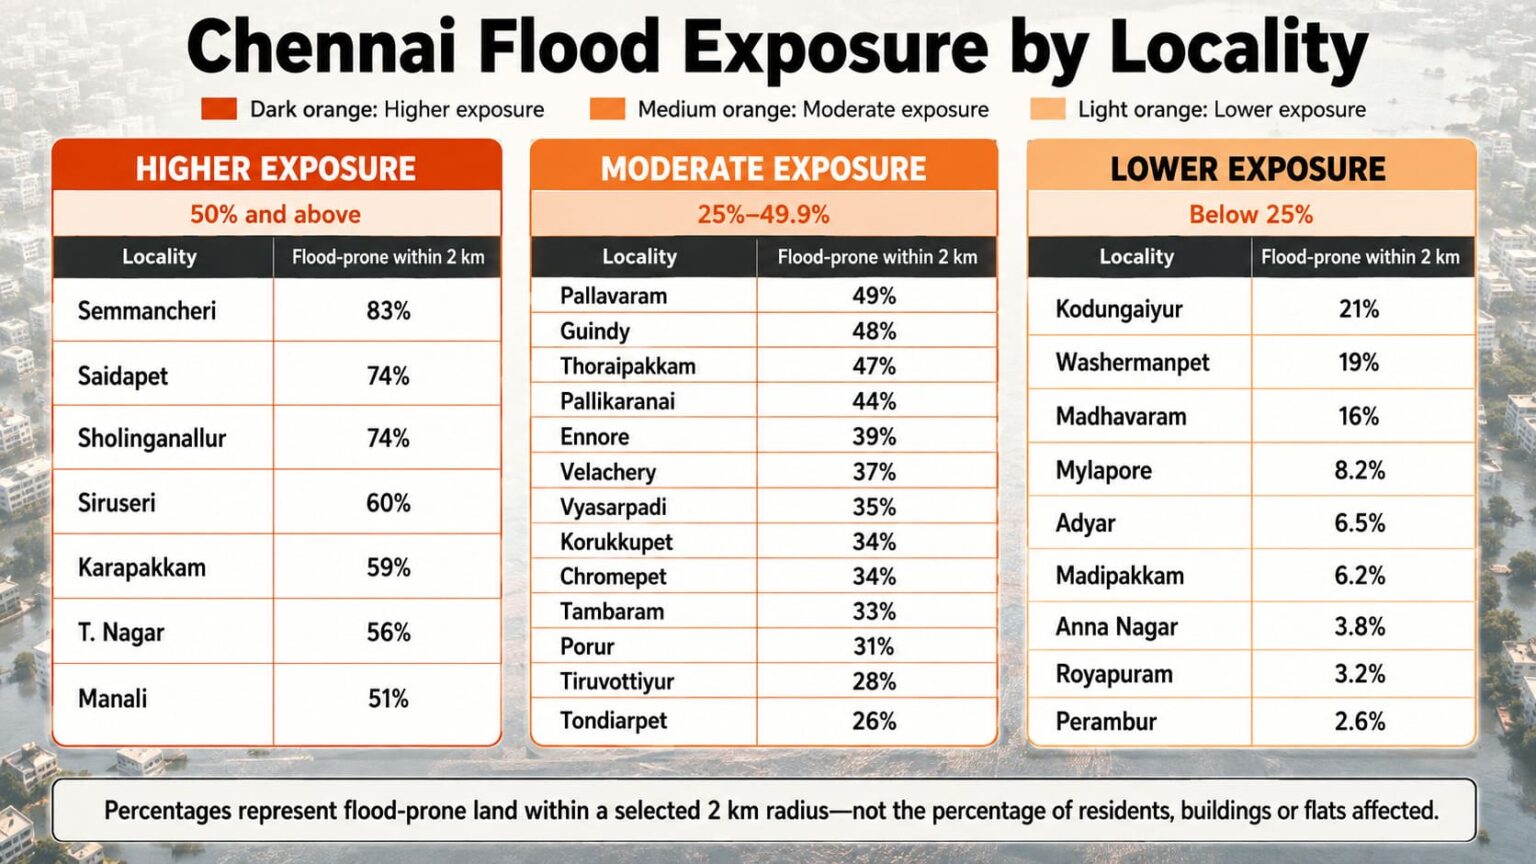
A district figure cannot tell a buyer whether a particular street or survey number is exposed. VRE therefore measured the flood-inundation layer within a 2 km radius from the centre of selected Chennai localities.
This is a circular study area, not an official ward boundary. The same method was used for every locality so that the figures can be compared consistently.
| Locality | Flood-prone within 2 km | Locality | Flood-prone within 2 km |
|---|---|---|---|
| Semmancheri | 83% | Thoraipakkam | 47% |
| Saidapet | 74% | Pallikaranai | 44% |
| Sholinganallur | 74% | Ennore | 39% |
| Siruseri | 60% | Velachery | 37% |
| Karapakkam | 59% | Vyasarpadi | 35% |
| T. Nagar | 56% | Chromepet | 34% |
| Manali | 51% | Tambaram | 33% |
| Pallavaram | 49% | Porur | 31% |
| Guindy | 48% | Tondiarpet | 26% |
These percentages refer to the land within the selected 2 km radius. They do not mean the same percentage of residents, buildings or flats will be affected.
North Chennai shows two different patterns
The outer parts of North Chennai record high exposure:
| Higher-exposure locality | Flood-prone within 2 km |
|---|---|
| Manali | 51% |
| Ennore | 39% |
| Vyasarpadi | 35% |
| Korukkupet | 34% |
| Tiruvottiyur | 28% |
| Tondiarpet | 26% |
| Kodungaiyur | 21% |
Some older and more central North Chennai localities record much lower figures:
| Lower-exposure locality | Flood-prone within 2 km |
|---|---|
| Washermanpet | 19% |
| Madhavaram | 16% |
| Royapuram | 3.2% |
| Perambur | 2.6% |
Other comparison figures are:
- Anna Nagar: 3.8%
- Adyar: 6.5%
- Mylapore: 8.2%
- Madipakkam: 6.2%
A lower figure does not make a locality completely flood-safe. It only means less of the measured land falls within this particular mapped inundation layer.
Rainfall alone does not decide flood exposure
The most important factor is not merely how much rain an area receives. The question is where the water goes after it lands.
Rain falling on elevated or sloping terrain can drain away. Water falling on flat, low-lying land close to sea level may remain trapped, particularly where channels, tanks and natural drainage paths have been narrowed or blocked.
That is why a locality receiving moderate rainfall can still face serious flooding. Property buyers must examine:
- Natural ground level
- Road level
- Neighbouring plot levels
- Nearby tanks and water bodies
- Canals and stormwater channels
- The final outlet through which water leaves the area
The 2015 Chennai Floods
During a powerful El Niño in late 2015, coastal Tamil Nadu suffered severe flooding. On December 1, parts of Chennai received nearly 494 mm of rain in just one day—the heaviest rainfall the city had seen in over 100 years.
The flood waters covered Chennai, Kancheepuram, and Tiruvallur (three of the seven districts mentioned above) and affected over 4 million people. Across Tamil Nadu, more than 400 people lost their lives, and financial losses reached over 3 billion US dollars.
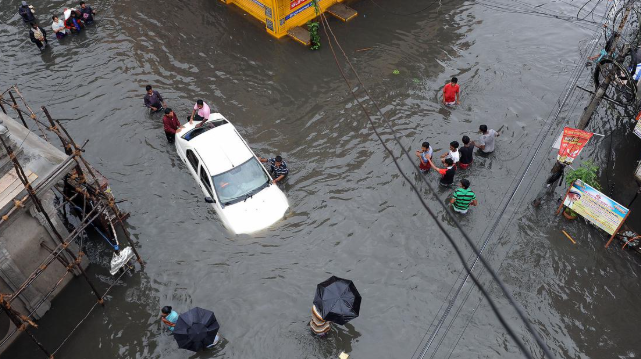
The heavy downpour in early December 2015
How El Niño Fits In
El Niño did not cause this single flood on its own, and scientists cannot predict a specific flood months before it happens. However, strong El Niño patterns make heavy rain much more likely during the northeast monsoon in this region. The 2015 floods showed just how severe that rain can get.
Property documents may not reveal flood risk
A flood-inundation zone is not an encumbrance, charge, or title defect.
- Encumbrance Certificate shows transactions, not terrain.
- Patta/chitta show ownership and classification, not flood risk.
- Sale deed may not mention flooding.
- Layout approval doesn’t ensure flood safety.
So a plot can look legally clear but still lie in a flood zone. Flood risk must be checked separately using spatial data.
Data Methodology and Map Limitations
To ensure total accuracy, Tamil Nadu’s 16,222 flood zones were merged without duplicate counts and measured using a precise grid system (UTM Zone 44N). Flood exposure was calculated as a percentage of each district’s total size, allowing fair comparisons—like Nagapattinam (47%) and Chennai (36%)—with less than 0.1% total margin of error against official state area figures.
However, because maps use 200-meter resolution blocks, checking a single coordinate can be misleading:
- Mudichur: A single-point check returned “safe,” yet 55.1% of the surrounding land (within 2 km) is flood-prone.
- Tambaram: A single point showed “safe,” but 33.0% of the surrounding area is at risk.
Checking one specific plot coordinate is only an initial screen—always analyze the wider surrounding area to evaluate true flood risk.
Seven questions to ask before signing
- What is the exact survey number?
Check whether any portion of the survey field intersects a mapped flood-inundation zone. Do not rely only on the locality name. - What is the property’s elevation?
Compare the plot or building level with the road, neighbouring properties and nearby water channels. - Where does rainwater leave the area?
Locate the nearest tank, canal, river or stormwater channel and understand what happens when it becomes full. - Was the land raised with filled earth?
Ask about the natural ground level and whether neighbouring plots and access roads were also raised. - What happened during December 2015 and December 2023?
Speak to people who live on the street. Ask how high the water rose and how long it remained. - Is the layout approved, and was drainage examined?
Find out whether the approving authority maintains a flood or drainage layer for the area. - For an apartment, where are the critical services located?
Check the plinth, basement, car park, electrical room, switchgear, transformer, generator, sump and pumps.
What buyers should understand
A flood map is a screening tool, not a flood certificate.
It cannot tell you:
- the future water depth,
- frequency or duration of flooding,
- fully reflect recent construction,
- raised layouts,
- narrowed channels or
- newly built drains.
However, ignoring mapped flood exposure is a serious due-diligence gap—especially when buying in Chennai’s southern growth corridor and Chengalpattu.
Before anything in real estate, think Verified.RealEstate.
Check any the area of the property in Tamil Nadu against flood zones, water bodies, coastal regulation, heritage restrictions, forest land and planning rules at verified.realestate.