

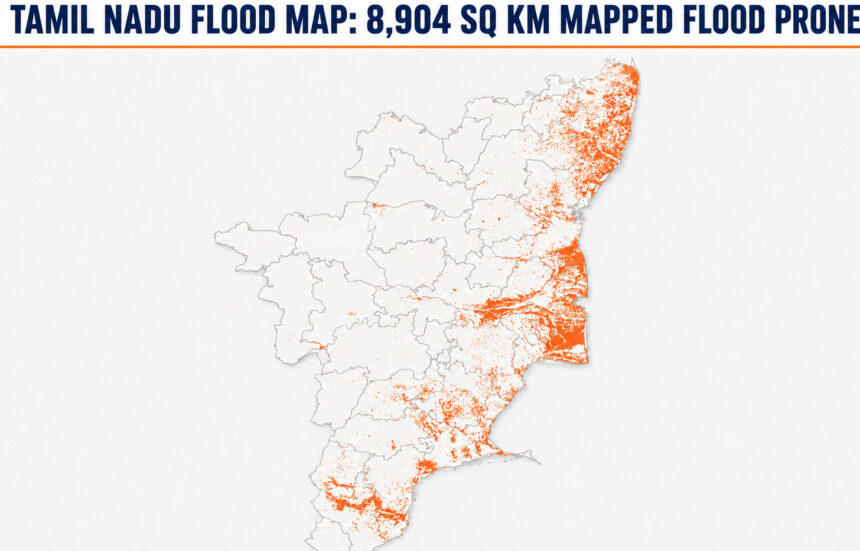
Tamil Nadu contains thousands of square kilometres of land that has been mapped as flood-inundation-prone. But the flooding risk is not spread evenly across the state.
Verified.RealEstate studied the complete ^flood-inundation map. It contains 16,222 mapped flood areas, called *polygons. VRE compared these polygons with the boundaries of all 38 revenue districts in Tamil Nadu.
The result is clear:
- 8,904 sq km of Tamil Nadu is mapped as flood prone.
- That is approximately 2,200,344 acres.
- It represents 6.84% of the state.
- Seven districts have at least 20% of their land mapped as flood prone.
- Eleven districts have at least 10%.
- All 38 districts contain at least some mapped flood-prone land.
^A flood-inundation layer is a map layer that shows areas likely to be submerged during flooding events.
*A polygon is a closed shape used on a digital map to mark a specific area. Here, each polygon represents a separate patch of land identified as flood-inundation-prone.
What may happen this October
Tamil Nadu gets much of its important seasonal rain from the northeast monsoon between October and December. Coastal districts receive a large share of their yearly rain during these three months.
El Niño affects India’s two monsoons differently :-
- It often weakens the southwest monsoon across much of India.
- But during October–December, El Niño conditions can be linked to more rain and heavier rainfall events over South India.
VRE’s analysis records the following forecast position:
| Source | Date | Forecast recorded in the analysis |
|---|---|---|
| NOAA CPC | 9 July 2026 | El Nino Advisory in effect. “El Nino continues and will strengthen through the end of the year.” |
| IRI, Columbia University | 20 July 2026 | Nino 3.4 index at +2.1 degrees C on 15 July. 23 of 26 models forecast a very strong event peaking in October to December 2026. |
| NOAA Climate Prediction Center | 3 August 2026 | El Nino is present and strengthening. 81% chance of a very strong El Nino during October to December 2026. 97% chance it persists into early spring 2027. |
A very strong El Niño means the Niño 3.4 index is +2.0°C or higher.
Forecasts place the possible peak close to +3.4°C in October. If this happens, it would be one of the strongest El Niño events in the record going back to 1950.
This forecast does not prove that a flood will happen. It also cannot tell us whether a particular road, neighbourhood or survey field will flood.
But it makes it more important to understand where Tamil Nadu’s flood-prone land is located before the northeast monsoon begins.
The statewide number: 8,904 sq km
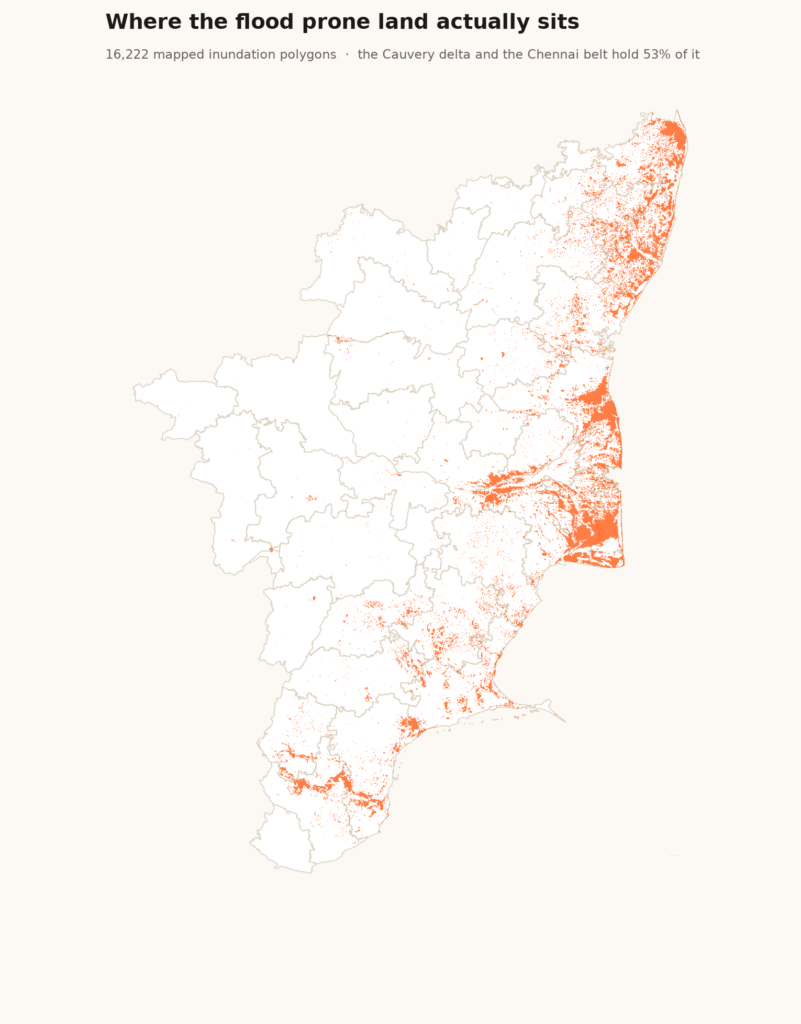
Every orange mark on the map represents a mapped flood-inundation area.
Most of the mapped land is on Tamil Nadu’s eastern side.
The main pattern is:
- It follows the coast from Tiruvallur through Chennai.
- It spreads across Chengalpattu.
- It forms a large and dense cluster across the Cauvery delta.
- It continues through the middle and southern coastal districts.
- It becomes much thinner across western Tamil Nadu.
| Statewide measure | Value |
|---|---|
| Total mapped flood-prone area | 8,904 sq km |
| Equivalent in acres | 2,200,344 acres |
| Share of Tamil Nadu | 6.84% |
| Mapped flood polygons | 16,222 |
| Districts with mapped flood-prone land | 38 of 38 |
| Districts at or above 20% | 7 |
| Districts at or above 10% | 11 |
District by district: the complete table
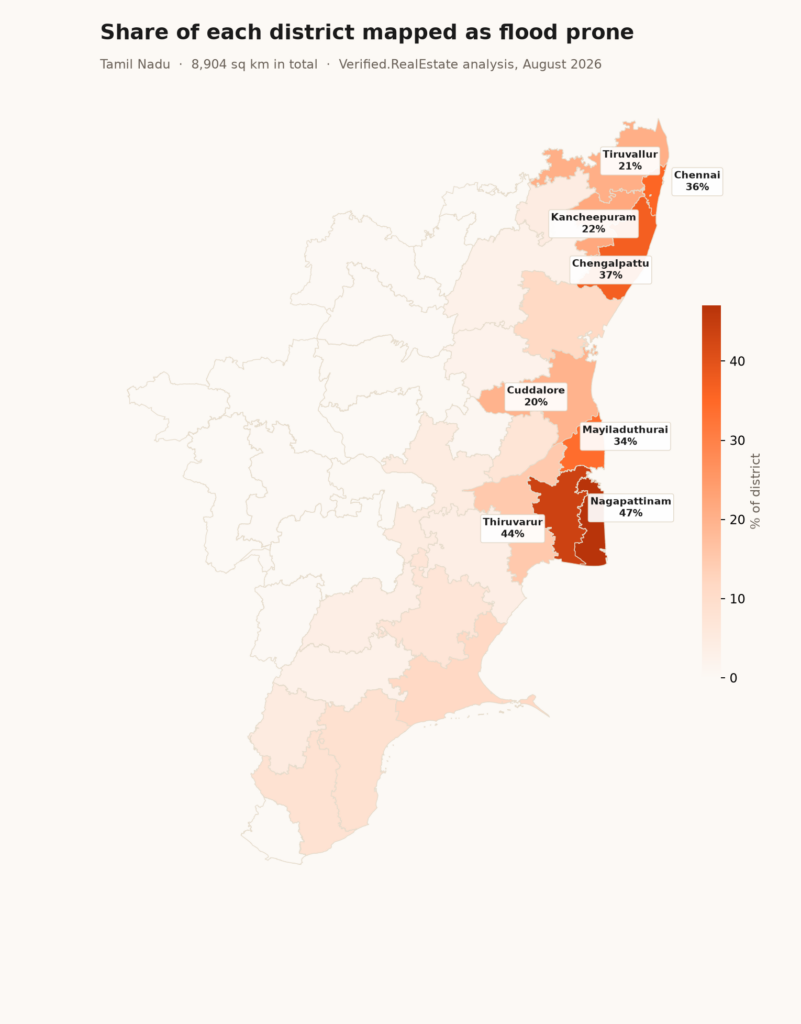
The districts below are ranked by the share of their own area mapped as flood prone. The rainfall column shows average annual rainfall. It is included to demonstrate that rainfall and flood exposure do not always move together.
| Rank | District | Flood-prone share | Flood-prone area | Acres | Annual rainfall |
|---|---|---|---|---|---|
| 1 | Nagapattinam | 47.05% | 649 sq km | 160,492 | 1,350 mm |
| 2 | Thiruvarur | 43.68% | 996 sq km | 246,191 | 1,100 mm |
| 3 | Chengalpattu | 36.99% | 978 sq km | 241,613 | 1,215 mm |
| 4 | Chennai | 35.62% | 157 sq km | 38,867 | 1,400 mm |
| 5 | Mayiladuthurai | 34.04% | 400 sq km | 98,795 | 1,150 mm |
| 6 | Kancheepuram | 21.93% | 374 sq km | 92,357 | 1,215 mm |
| 7 | Tiruvallur | 20.66% | 667 sq km | 164,790 | 1,200 mm |
| 8 | Cuddalore | 19.71% | 730 sq km | 180,301 | 1,180 mm |
| 9 | Thanjavur | 15.19% | 519 sq km | 128,178 | 1,050 mm |
| 10 | Ramanathapuram | 11.71% | 480 sq km | 118,694 | 850 mm |
| 11 | Villupuram | 11.44% | 457 sq km | 112,844 | 1,100 mm |
| 12 | Thoothukudi | 8.85% | 418 sq km | 103,353 | 680 mm |
| 13 | Tirunelveli | 8.43% | 327 sq km | 80,760 | 750 mm |
| 14 | Ariyalur | 7.52% | 146 sq km | 36,069 | 945 mm |
| 15 | Sivagangai | 7.21% | 306 sq km | 75,569 | 880 mm |
| 16 | Tenkasi | 5.13% | 145 sq km | 35,840 | 750 mm |
| 17 | Tiruchirappalli | 4.89% | 220 sq km | 54,356 | 820 mm |
| 18 | Ranipet | 4.73% | 88 sq km | 21,649 | 990 mm |
| 19 | Pudukkottai | 3.98% | 186 sq km | 45,929 | 900 mm |
| 20 | Madurai | 3.92% | 144 sq km | 35,521 | 850 mm |
| 21 | Tiruvannamalai | 3.08% | 191 sq km | 47,100 | 1,000 mm |
| 22 | Virudhunagar | 2.90% | 123 sq km | 30,464 | 800 mm |
| 23 | Kallakurichi | 2.40% | 79 sq km | 19,526 | 1,050 mm |
| 24 | Perambalur | 0.96% | 17 sq km | 4,202 | 920 mm |
| 25 | Karur | 0.48% | 14 sq km | 3,420 | 680 mm |
| 26 | Salem | 0.40% | 21 sq km | 5,243 | 780 mm |
| 27 | Dharmapuri | 0.29% | 13 sq km | 3,300 | 830 mm |
| 28 | Tiruppur | 0.29% | 15 sq km | 3,592 | 700 mm |
| 29 | Theni | 0.28% | 8 sq km | 1,995 | 700 mm |
| 30 | Krishnagiri | 0.24% | 12 sq km | 3,071 | 800 mm |
| 31 | Coimbatore | 0.16% | 8 sq km | 2,021 | 700 mm |
| 32 | Kanniyakumari | 0.15% | 3 sq km | 606 | 1,550 mm |
| 33 | Dindigul | 0.12% | 7 sq km | 1,809 | 850 mm |
| 34 | Namakkal | 0.08% | 3 sq km | 699 | 750 mm |
| 35 | Vellore | 0.08% | 2 sq km | 439 | 990 mm |
| 36 | Tirupathur | 0.05% | 1 sq km | 238 | 950 mm |
| 37 | The Nilgiris | 0.02% | 1 sq km | 156 | 1,920 mm |
| 38 | Erode | 0.02% | 1 sq km | 295 | 720 mm |
Nagapattinam has the highest percentage exposure at 47.05%. Thiruvarur has the largest mapped area among the leading districts, with 996 sq km or 246,191 acres.
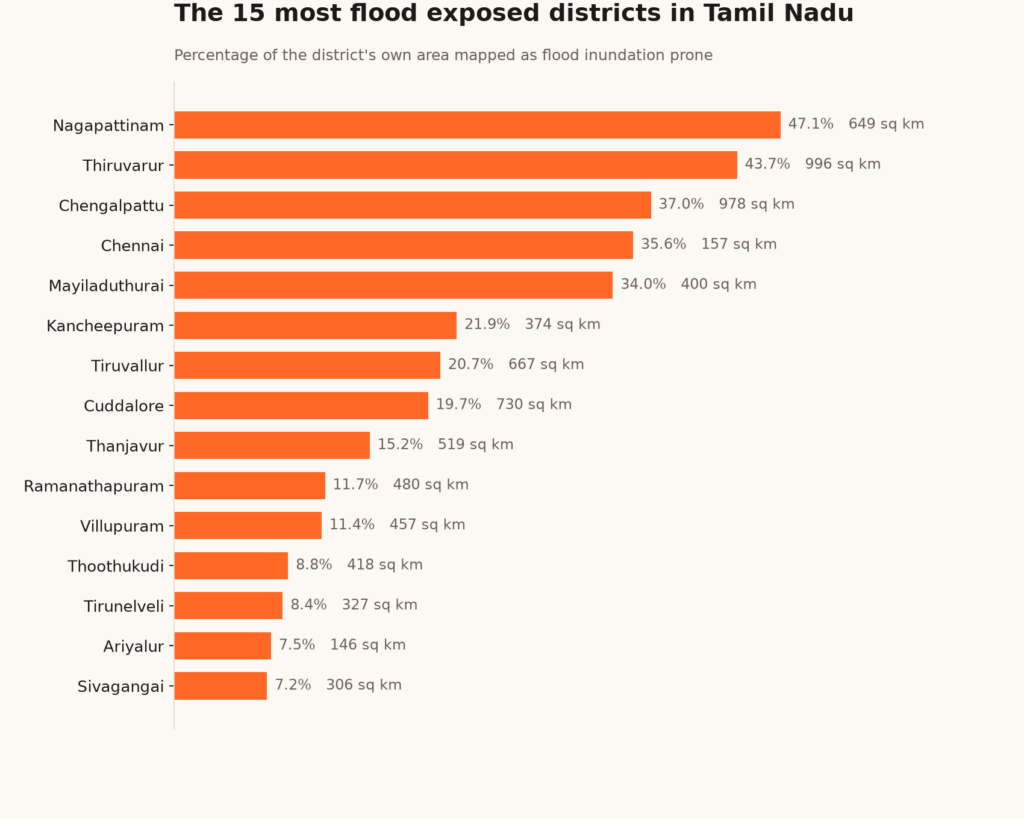
The belts holding most of the exposed land
A large part of Tamil Nadu’s mapped flood-prone land is concentrated in a few connected regions.
Eight districts in the Cauvery delta and Chennai metropolitan belt occupy about 12% of Tamil Nadu’s total land area. But they contain 53% of the state’s mapped flood-prone land.
| Belt | Districts | Combined flood-prone share | Extent |
|---|---|---|---|
| Cauvery delta | Nagapattinam, Thiruvarur, Mayiladuthurai and Thanjavur | 31.08% | 633,656 acres |
| Chennai metropolitan belt | Chennai, Chengalpattu, Kancheepuram and Tiruvallur | 27.14% | 537,627 acres |
| Middle coastal belt | Cuddalore and Villupuram | 15.42% | 293,145 acres |
When Tamil Nadu’s 15 coastal and deltaic districts are compared with its 23 inland districts:
- Coastal and deltaic districts are 17.06% flood prone.
- They contain 82.4% of all mapped flood-prone land in Tamil Nadu.
- Inland districts are only 1.79% flood prone.
This means the mapped exposure in the coastal and delta group is nearly ten times higher than in the inland group.
The Chennai metropolitan belt
Chengalpattu is 36.99% flood prone, representing 978 sq km or 241,613 acres. This includes important property markets along the OMR and GST Road corridors.
Chennai district itself is 35.62% flood prone, covering 157 sq km. Kancheepuram records 21.93%, while Tiruvallur records 20.66%.
The full locality-level analysis for Chennai and Chengalpattu is covered separately in VRE’s Chennai flood-risk article: https://community.verified.realestate/article/chennai-flood-risk-map-36-of-the-chennai-city-and-37-of-chengalpattu-are-identified-as-flood-prone/
Rain is not what decides it—terrain is
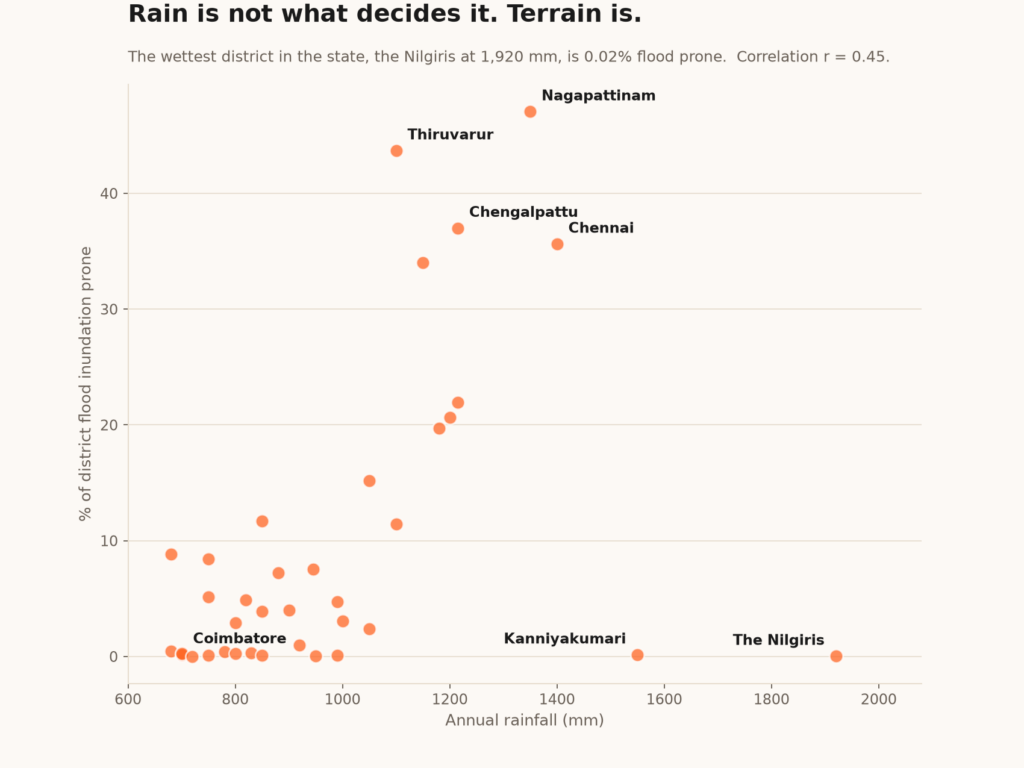
One of the key findings is that higher rainfall does not necessarily mean higher flood exposure.
The Nilgiris, Tamil Nadu’s wettest district, receives about 1,920 mm of rain annually, but only 0.02% is mapped as flood prone. Kanniyakumari gets 1,550 mm, yet only 0.15% is flood prone. In contrast, Thiruvarur receives around 1,100 mm, but 43.68% of its area is flood prone.
Across all 38 districts, the correlation between rainfall and flood-prone area is r = 0.45, meaning rainfall explains only about 20% of the variation.
The rest is driven by terrain and drainage factors such as – land slope, elevation, rivers, channels, and tank systems. Water drains easily on elevated or sloping land, but can accumulate in flat delta regions near sea level.
So, more rain does not automatically mean more flood risk, and less rain does not guarantee safety. The key question is: where does the water go after it falls?
What the last very strong El Niño looked like
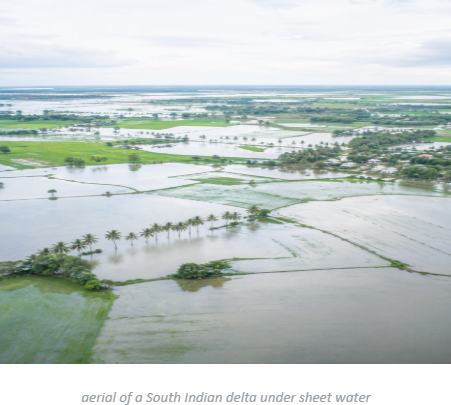
The last very strong El Niño occurred during Tamil Nadu’s 2015 northeast monsoon.
On 1 December 2015, Chennai recorded about 494 mm of rain in a single day, the heaviest in over a century.
Across Tamil Nadu:
- Over 400 deaths were reported
- More than 4 million people were affected
- Economic losses were estimated at around US$3 billion, with higher estimates in some reports
- Chennai, Kancheepuram and Tiruvallur were among the worst hit
These same three districts are also among the seven where VRE finds at least 20% mapped flood exposure. El Niño alone did not cause the 2015 floods.
Similarly, the 2026 El Niño forecast cannot predict specific floods.
🔴 It only highlights the risk when extreme northeast monsoon rain falls on already highly exposed land.sequences when extreme northeast monsoon rainfall falls over heavily exposed terrain.
Why property paperwork may not reveal flood exposure
A mapped flood-inundation zone is not treated as:
- An encumbrance
- A title defect
- A financial charge on the property
Because of this:
- An Encumbrance Certificate can be clear because an EC records property transactions and charges, not the shape or level of the land.
- Patta and chitta can be correct because they record ownership and land classification, not flood exposure.
- A sale deed may not mention earlier flooding.
- A property may have planning or layout approval, but that approval does not guarantee that the land will never flood.
A plot can pass all the usual legal-document checks and still stand in the middle of a mapped flood-inundation area.
Flood exposure must be checked separately using the spatial flood record..
How Verfied.RealEstate measured the flood-prone area
Verifeid,RealEstate is publishing its method because readers must understand how the statewide figure of 8,904 sq km was calculated.
1. Complete flood-inundation layer
The full layer containing 16,222 mapped polygons was used. It covers every district from Tiruvallur in the north to Kanniyakumari in the south, between approximately latitude 8.20° and 13.56°.
2. Overlapping polygons were dissolved
Where two flood polygons touched or overlapped, the shared area was counted only once.
- Raw total before overlaps were removed: 896,372 hectares
- Total after the polygons were joined: 895,836 hectares
- Duplicate overlap removed: approximately 536 hectares
3. Data analysed after converted measurement
The layer was converted to UTM Zone 44N, which measures it in metre-based coordinate system.
Calculating land area directly using latitude and longitude degrees can produce distorted results. Reprojection was therefore necessary for reliable hectare and square-kilometre measurements.
4. District boundaries were intersected
The dissolved or merged flood layer was intersected with all 38 revenue-district boundaries.
Each district’s percentage was calculated as:
Mapped flood-prone area inside the district ÷ total district area × 100
This makes differently sized districts directly comparable.
District-boundary completeness check
The combined area of the 38 district polygons was 130,197 sq km.
Tamil Nadu’s official area is 130,058 sq km.
The difference is only about 0.1%, and this can happen because digital map boundaries are simplified. This check shows that no district was missing or seriously counted twice.
Centre-point cross-check
VRE also performed a second, simpler check by assigning each complete polygon to the district containing its centre point.
- Centre-point method: 894,990 hectares
- District-intersection method: 890,449 hectares
The two methods agree within approximately 0.5% at the state level.
Most differences occur in the Cauvery delta, where polygons cross the boundaries of Nagapattinam, Thiruvarur and Mayiladuthurai.
The district-intersection figures are used throughout this article because they correctly divide cross-border polygons rather than assigning the entire polygon to one district.
Limits of the data
👉It is a screening tool, not a certificate
The flood layer operates at approximately 200-metre resolution.
A single coordinate can fall between mapped polygons and return a clear result even when the surrounding land is highly exposed.
VRE found that single-point tests initially returned clear results for Mudichur and Tambaram. Area-based measurements showed:
- Mudichur: 55.1% flood prone within 2 km
- Tambaram: 33.0% flood prone within 2 km
A single clear coordinate must not be treated as an all-clear for the full property.
👉It does not show flood depth or flood frequency
The layer only shows whether land is mapped as flood-inundation-prone. It does not show:
- Expected flood depth
- Frequency
- Duration
- Type of storm
- Return period
It cannot be described as a “1-in-100-year flood line.”
👉It cannot show every recent development
Drainage conditions change over time. Lakes may be encroached, channels narrowed and plots raised using filled earth. New layouts may be elevated while neighbouring land remains low.
A static flood layer cannot capture every recent change, particularly in fast-developing districts such as Chengalpattu.
👉Percentages refer to land area
Chennai being 35.62% flood prone means 157 sq km of land is mapped. It does not mean that 35.62% of Chennai’s residents, buildings or flats will necessarily be affected.
What property buyers should do
Before buying land or a flat:
- Type in the location of the Property in https://verified.realestate/dashboard/utility/flood-inundation-finder and find if it lies in the flood zone.
- Do a physical site visit. (would help if you visit during rainy days)
- Examine the site’s elevation against the road.
- Identify nearby tanks, canals, channels and rivers.
- Find out where water leaves when the drainage system is full.
- Ask whether the layout was raised with filled earth.
- Speak to residents about the December 2015 and December 2023 floods.
- For apartments, inspect the plinth, basement, electrical room, switchgear, generator, sumps and pumps.
Sources and notes
The flood-inundation area, district percentages, belt totals, locality measurements and rainfall correlation were calculated by Verified.RealEstate in August 2026.
VRE used Tamil Nadu’s state flood-inundation layer and revenue-district boundaries. The complete calculation method is explained in Section 8.
The El Niño information comes from:
- The NOAA Climate Prediction Center ENSO Diagnostic Discussion
- The International Research Institute for Climate and Society forecast
The link between El Niño and the northeast monsoon over South India is recorded in published climate studies, including research in MAUSAM, the journal of the India Meteorological Department.
The December 2015 rainfall, death and economic-loss figures come from published records, reinsurance assessments and news reports from that period.
The annual rainfall figures are based on Tamil Nadu’s state rainfall record.
Before anything in real estate, think Verified.RealEstate.
Check any survey number in Tamil Nadu against flood zones, water bodies, coastal regulation, heritage restrictions, forest land and planning rules at verified.realestate which uses both – AI analysis to pull out 30+ checks from the government records and – offline site checks.